


 Stores are getting better and better for consumers. Brick-and -mortar retailers have been under assault by internet-based retailers for roughly two decades. US consumers have evolved in their shopping habits, willing to buy increasingly expensive and complex items online, impacting traditional stores. Retail internet sales are roughly $890 billion (13%) of the $6.9 trillion in annual retail sales overall.

 With its 13.6 billion square feet, the education segment encompasses more commercial space than health care and hospitality (lodging) combined. Two in seven Americans are students. Two-thirds of those students are in a K-12 school. One in eighty-five Americans is a K-12 teacher; over 4 million teachers comprising 2.5% of the working population. In many districts, the school system is one of the largest employers. Education facilities form the fabric of communities, often drawing public interest regarding performance, conditions, programs, and sporting events.
Colleges and universities employ roughly 1.3 million faculty members with growth of 3.5% in that figure over the past ten years. However, expected employment growth in the coming ten years of 12% is much higher than the average for all occupations. Overall, colleges and universities employ 2.9 million people; 45% faculty and 55% in other capacities. America’s 4,562 colleges and universities have just under 20 million students. Colleges and universities are cities unto themselves, encompassing broad commercial sector capacities and characteristics including health care, hospitality, restaurant and food service, retail, office, public affairs, infrastructure, and other areas.
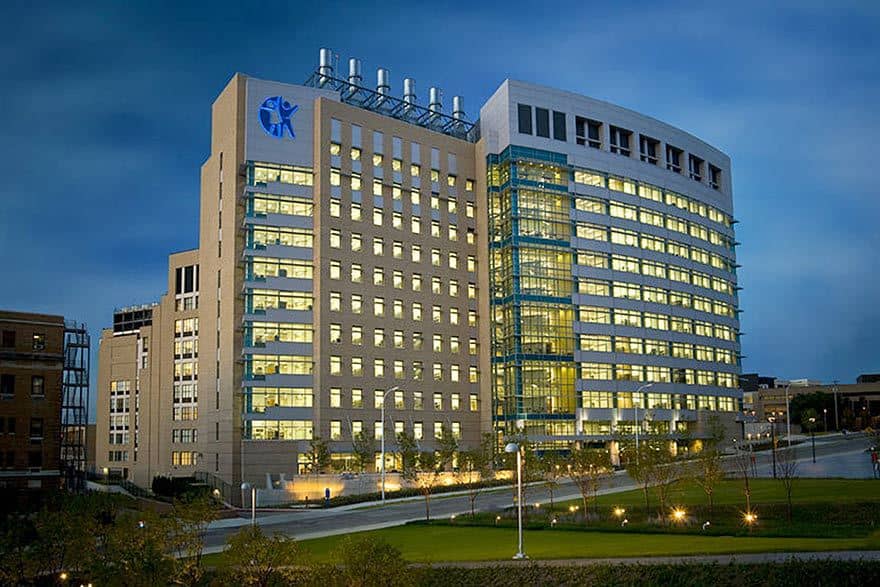
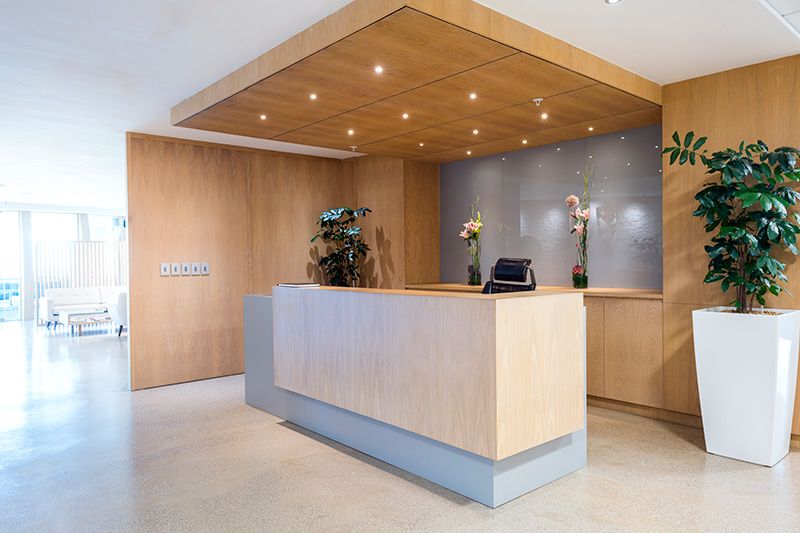 The 184,596 hotels in the US provide more than 5.3 million rooms in the hospitality industry, generating $258 billion in annual revenues. The industry has produced some of the best-known brand names in the US, including Hilton, Marriott, Hyatt, Wyndham, Sheraton, Best Western, and many others. Perhaps no other industry was hurt more by the pandemic period, and its effects are still impacting the industry, if not changing it altogether. Business travel plummeted during the pandemic, and many travelers learned some new brand names, including Zoom, Go To Meeting, and Google Meet.
Revenue per available room now exceeds expectations with growth in the industry linked to vacation or leisure travel rather than business travel which still lags. Many hotel brands are reporting returns to pre pandemic revenue per available room figures. Challenges remain, including available labor to staff facilities. Hotels must shift strategies to use more technology to handle workloads while outsourcing for many functions.
Competition is fierce as hotel guests increasingly look for unique experiences, amenities, sustainability awareness, heightened cleanliness, and blending of business and leisure travel. Average daily room rates have reached an all-time high in the industry even as guests consider non-chain hotels, boutique providers, and alternative lodging options with brands such as Airbnb and Vrbo. The industry is emerging from the pandemic, but is changing as it moves to serve quite different guest priorities.

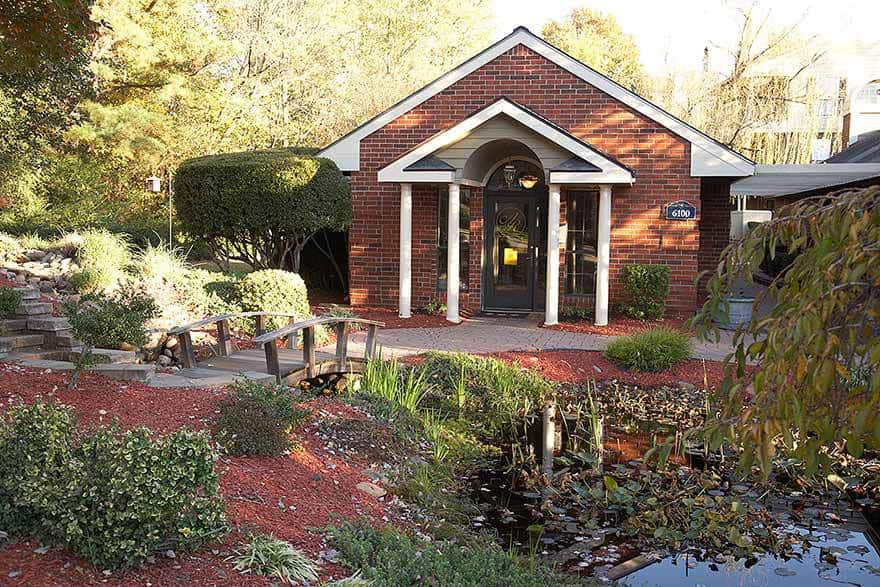
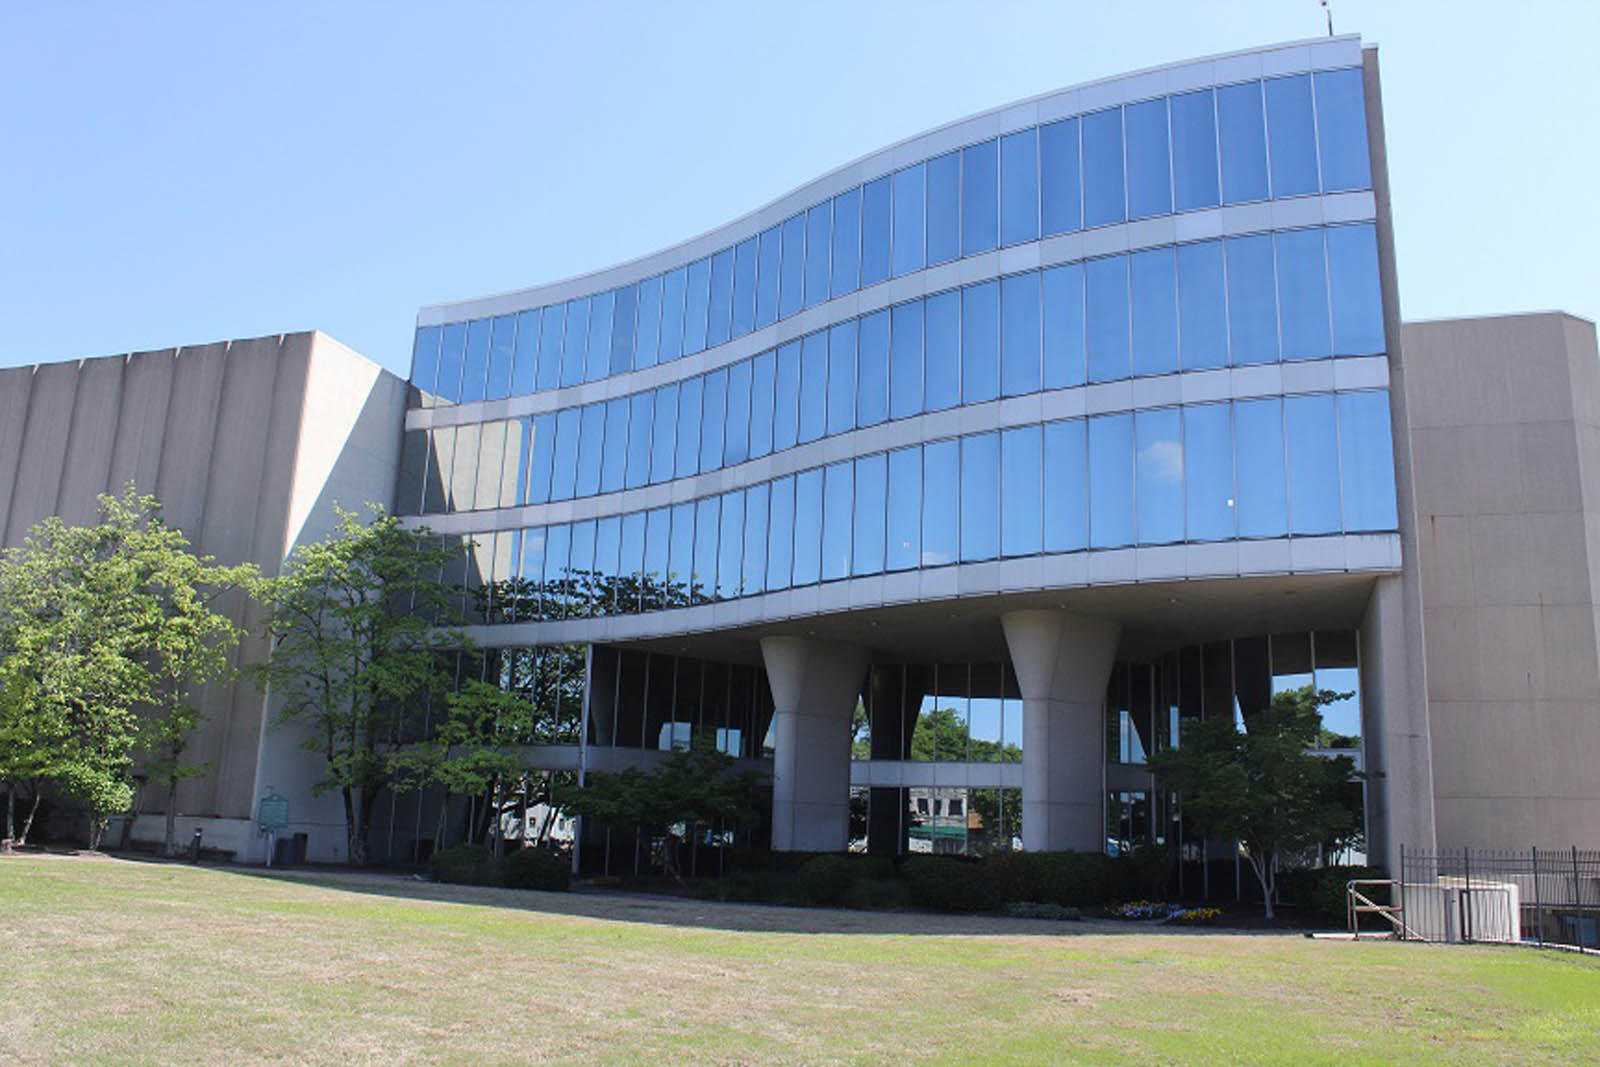
 The scope, diversity of work, and financial influence of office real estate cannot be overstated. Indeed, most of the economy is directed, managed, and monitored from within the office sector. Administrative and professional services utilize 9.2 billion square feet of commercial space (56% of office space and 10% of all commercial space). Mixed-use facilities are growing quickly, representing 3.4 billion square feet (20% of office space and 4% of all commercial space). Government agencies occupy 2.5 billion square feet (15% of office space and 3% of all commercial space).
Demand remains high among office spaces in the fastest growing markets (9 of which are in the South and Southeast). Many core business districts are struggling with higher vacancy rates. In addition, a split has occurred with prime office spaces doing well, while secondary office buildings seeing lesser demand. The impact of trends such as work-from-home (see more on that below) are certainly influencing office space demand, but so are a lower number of workers overall. New office space construction is down 27% as developers respond to vacancies and changing priorities such as office placement for shorter commutes and demand for greater amenities. In many areas, rental rates are down by 25% and in others, declines of 40% have been seen. Competition for new tenants is fierce.
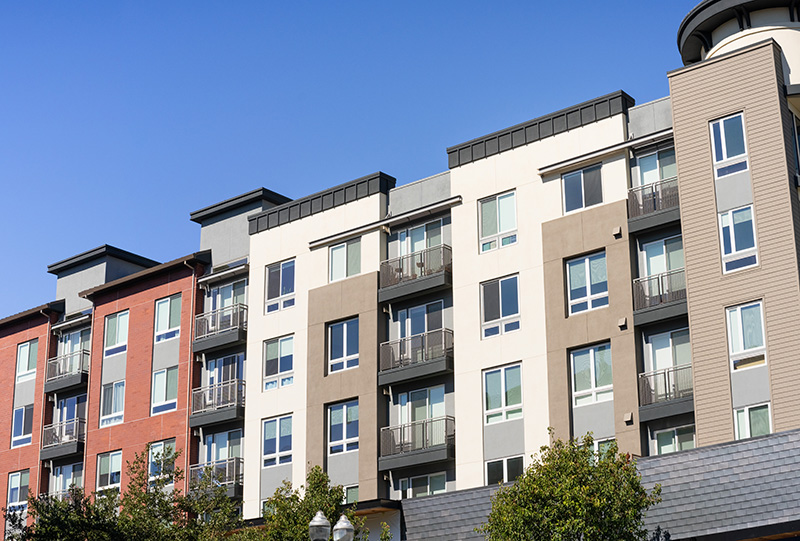
 Many in the millennial generation, but also within other generations, choose apartment living based on its greater flexibility, sense of community, and evolving benefits such as:
- Thoughtful and varied floor plans
- Enhanced outdoor spaces – porches, balconies, planters, gardens, trails
- Communal spaces for gathering and events
- Eco friendly buildings – solar, energy efficiency, charging stations
- Remote work spaces and internet access support
- Smaller apartments – less cost, most usable space
In recent years, multifamily housing vacancy rates plummeted, rents skyrocketed, and apartment demand increased. Much of the activity revolves around higher end units often selected by those actively choosing apartment life over standalone homes. Home ownership by millennials is well below previous generations and that trend is not likely to lose momentum any time soon.
As interest rates have risen, the construction of new multifamily units has declined. The steep rent increases of the 2020 to 2022 period have declined, returning to more normal increases along with vacancy rates which had reached all-time lows. The multifamily sector remains robust and healthy, but without the extraordinary growth.
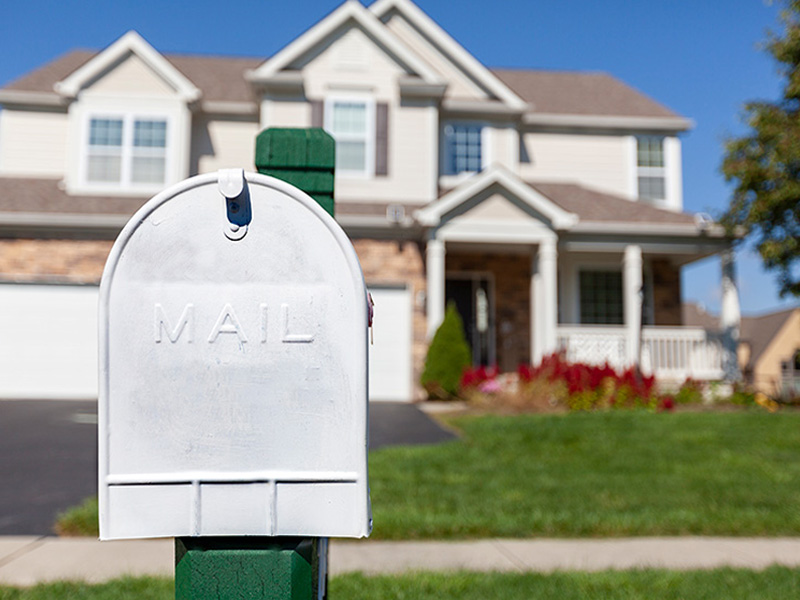
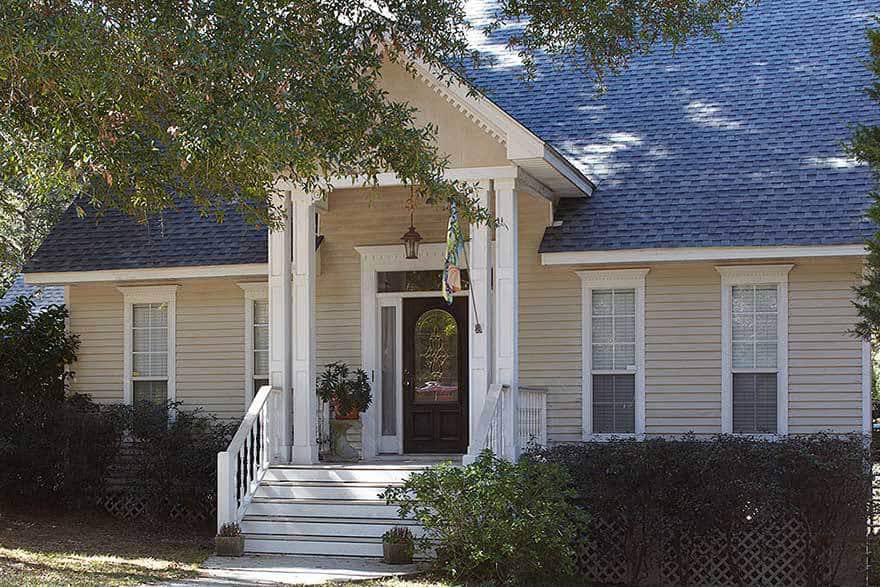
 Home ownership plays critical roles in the economy, job markets, individual financial wealth, American culture, and lifestyles. All of those areas are undergoing significant changes, impacting the home sector in profound ways.
Low interest rates from 2012 to 2019 and record-low rates from 2020 to 2021 prompted waves of home buying, snatching up available homes in mass. Now, home mortgage interest rates have risen to levels not seen since the year 2000 and correspondingly, mortgage demand sits at a 27-year low. Overall, mortgage activity fell 25% versus the prior year.
In addition to high mortgage rates, a shortage of homes for sale has impacted the residential sector with new listings down to some of the lowest levels in decades. Homeowners with low interest loans obtained in prior years are unwilling to move, which would exchange those low rates for new, much higher rates. The lack of housing inventory has pushed home prices to high levels with many home sales producing bidding processes with final sales prices above the original asking prices.